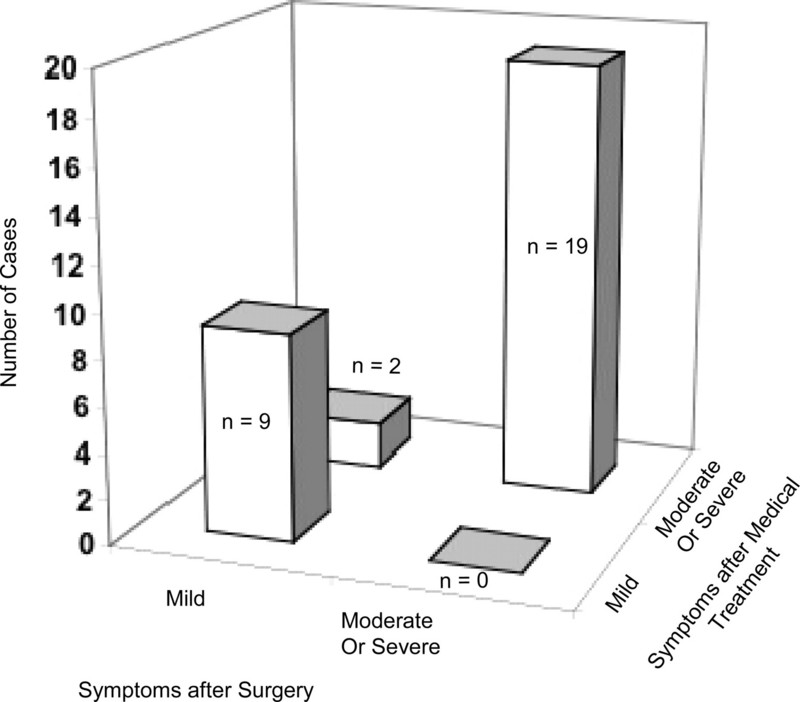
Figure 1. A really terrible graph of four values that should not be shown in a graph at all.
→グラフにする意味がない例!
CHESTの論文書きシリーズ。今回は、グラフ。とてもわかりやすい説明。シンプルがベストで、そのためにも伝えたいデータや関係が簡潔に、必要性をもって揃っていることが重要。
Two rules of good graphs are presented and explicated.
(CHEST 2006; 130:620-621)
全文が読めます。
I am at a loss for words. I did not expect that looking through recent issues of CHEST would cause both relief and disappointment. Relief, because the topic this month is still relevant. The need for advice about graphs is as strong now as at any time in at least 2 decades. Disappointment, for the same reason: newly published medical literature still has far too many graphs that are unnecessary, distracting, difficult to decipher, and sometimes even deceptive. At the risk of oversimplification, I suggest that there are two rules of good graphs.
→ 著者は相当がっかりしているらしい。そして、わかりやすいグラフを作成するポイント(2つだけ!)を教えてくれるという。
First, a good graph shows data that deserve to be graphed. It displays or reveals relations or patterns that would be hard to grasp if the data were shown in running text or in a table.
第1に、よいグラフはグラフ化するに相応しいデータを表している。つまり、文章や表にするとわかりにくくなる関係やパターンを示しているのである。
Second, a good graph succinctly emphasizes the data, not the graph itself. Just as good writing has no needless words,1 good graphs have no distracting lines or other needless marks of any kind.
第2に、よいグラフはグラフそのものでなく、データを簡潔に表している。よい文章に不必要な言葉がないのと同じように、よいグラフには注意をそらすような線や不必要な印がない。
著書が推薦している参考図書
『How to Report Statistics in Medicine』

- 作者: Thomas A. Lang,Michelle Secic
- 出版社/メーカー: Amer College of Physicians
- 発売日: 2006/12/30
- メディア: ペーパーバック
- 購入: 1人 クリック: 5回
- この商品を含むブログ (1件) を見る
これから)面接1名、医療安全、NEXT MEETING


コメント